Cloud Systems · Performance Isolation · Resource Management
ProPer
Profile-driven Performance Management Framework
Cloud workloads shift between compute-, cache-, and memory-intensive phases, but most resource controls don't. ProPer profiles applications offline and proactively repartitions cache and memory bandwidth at function boundaries — before contention hurts performance.
Existing resource managers struggle with changing applications
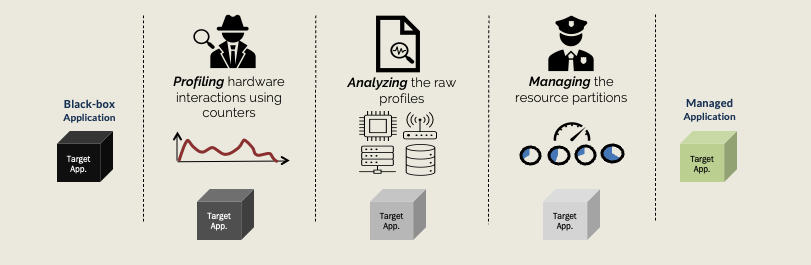
Applications transition between compute-, cache-, and memory-intensive phases. Existing systems either rely on static allocations or continuously monitor applications as black boxes at runtime to relearn their behavior. ProPer instead learns application behavior offline and proactively adjusts resource allocations at function boundaries.
- Application enters a memory-intensive phase
- Static quotas remain fixed, or runtime monitors begin observing behavior
- Reactive systems treat each execution as a black box and continuously re-learn resource demands
- Resource adaptation lags behind phase changes, increasing interference and overhead
- A function transition is observed
- The new execution phase is classified
- Cache and bandwidth quotas are updated proactively
- Performance interference remains bounded
Function boundaries reveal meaningful phase changes
Instead of reacting only to noisy short-term counter fluctuations, ProPer associates hardware-counter behavior with recognizable regions of application execution. Function transitions provide natural points for detecting phase changes and updating resource policies.
load_data()Memory-boundReads large dataset from diskfeature_extract()Cache-boundRepeated access to working setaggregate()Cache-boundHot join across tablesinfer()Compute-boundMatrix multiplyHow ProPer Works
ProPer turns low-overhead runtime measurements into enforceable cache and memory-bandwidth policies.
Collect hardware performance-counter samples using Linux perf.
Attribute measurements to application functions using SystemTap probes.
Normalize seven behavioral features and compare them with synthetic reference workloads.
Identify compute-, cache-, or DRAM-intensive execution phases.
Translate the detected phase into LLC and memory-bandwidth quotas.
Apply Intel CAT and a userspace DRAM bandwidth regulator.
What the profiler observes
Inside the Pipeline: Profiling to Enforcement
Phase Detective: Offline Profiler
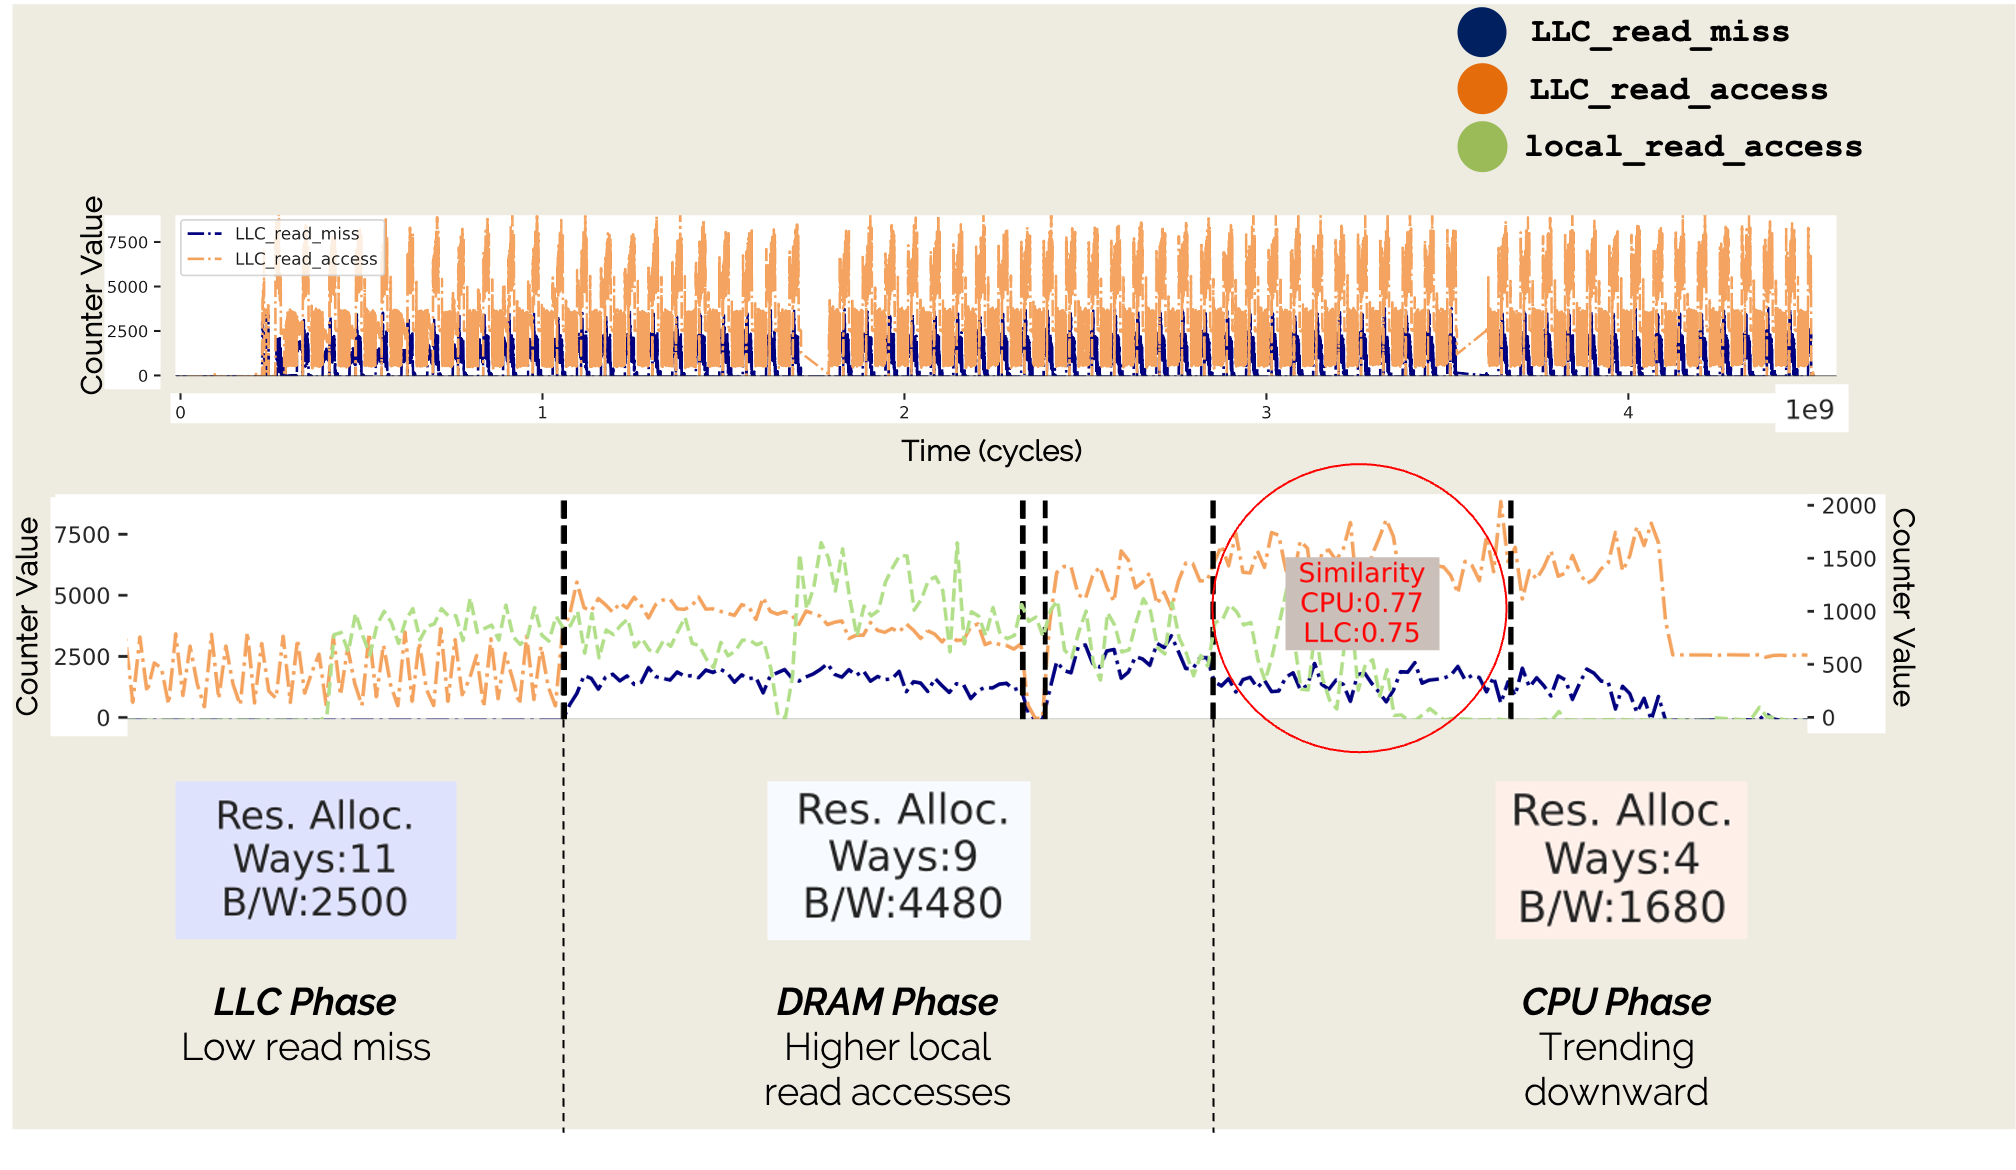
A Sampler collects hardware performance counter deltas — LLC read/write misses and accesses, DRAM local reads/writes, retired instructions — at 10 KHz using perf_event_open.
A Prober instruments function entry and return points via SystemTap, communicating through a shared memory-mapped circular buffer. Together they tie counter values to function boundaries across multiple runs.
Policy Generator: Phase Classification
The Policy Generator aligns Perf and SystemTap data temporally, then collapses short-lived functions (under ~100 µs) into their parents.
Each function iteration is classified as LLC-, DRAM-, or CPU-bound by similarity to synthetic reference workloads. A Phase Transition Point marks where the bottleneck changes at a function boundary, and each phase receives a cache-way allocation and a DRAM bandwidth quota.
load_data()feature_extract()aggregate()infer()Each function call is a candidate boundary for measuring and updating resource behavior.
Phase Enforcer: Online Management
A detector watches for function transitions that match the policy and flags the new phase. A driver process then adjusts Intel CAT cache partitioning and a custom DRAM bandwidth regulator to match — redistributing any unused resources to best-effort co-runners.
Intel MBA could not enforce bandwidth precisely at low levels, so ProPer uses a software throttle instead. See Results below for the measured comparison.
Implementation details
The driver runs at real-time (SCHED_FIFO) priority to guarantee timely enforcement and polls at 10 KHz. Because Intel MBA 2.0 could not throttle bandwidth below ~2000 MB/s and provided no useful write throttling, the custom USBW regulator uses a busy-loop throttle — pausing cores once measured bandwidth exceeds the phase quota — reaching enforcement down to ~500 MB/s.
Results: Lower Overhead, Finer Control, Less Interference
ProPer was evaluated under severe shared-resource contention to measure profiling overhead, enforcement precision, and application protection.
Low-overhead profiling
ProPer combines 10 kHz PMU sampling with 1,764 function probes while maintaining low average runtime overhead.
Fine-grained bandwidth control
More precise control than Intel MBA
Intel Memory Bandwidth Allocation did not provide sufficiently predictable control at low bandwidth levels. ProPer therefore uses a software bandwidth regulator capable of enforcing quotas down to approximately 500 MB/s—about four times finer than the practical minimum observed with Intel MBA.
✗ No reliable control below this floor; no useful write throttling
✓ Enforces quotas reliably down to this floor
Bar length shows the lowest bandwidth quota each system can reliably enforce — shorter means finer, more predictable control.
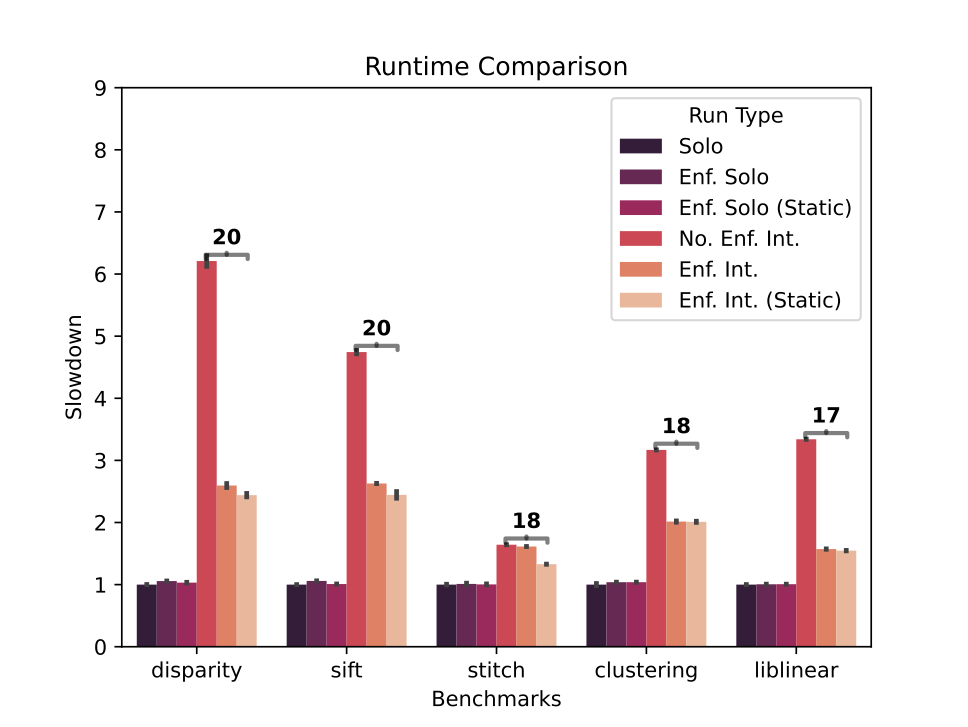
Reduced contention slowdown
Worst-case slowdown reduced from approximately 6× to 2.5×
Under 20-way contention, phase-aware cache and bandwidth management substantially reduced the worst observed application slowdown.
Future Directions
ML-Driven Policy Generation
Extending the system with machine learning models and AI-assisted tools to automatically derive resource management policies from profiling data at scale, removing the need for manual classification thresholds and enabling generalization to diverse real-world workloads.
Input-Aware Resource Management
Different inputs can change an application's phase structure and resource demands. Future systems could incorporate input characteristics to generate more precise resource policies.
Beyond Cache and Memory Bandwidth
Extend profile-driven management to other shared resources: memory capacity, interconnect bandwidth, storage I/O, network bandwidth, GPU memory systems, and accelerator resources.
Multi-Application Policy Generation
Current policies focus on protecting a target application. Future work could jointly optimize resource allocations across multiple performance-critical applications running simultaneously.
Cross-Platform Policy Transfer
Investigate whether profiles generated on one machine can be translated to another architecture, reducing the need for repeated profiling across deployment environments.
Integration with Cloud Schedulers
Combine ProPer with Kubernetes, OpenShift, or cluster schedulers so that placement and resource partitioning decisions are informed by profile-derived resource requirements.
My Role
Function-Level Profiler
Combined PMU sampling with function-boundary tracking to characterize runtime behavior.
Phase Classifier
Compared normalized application signatures with compute-, cache-, and DRAM-focused reference workloads.
Policy Engine
Mapped detected application phases to cache and memory-bandwidth allocations.
Bandwidth Regulator
Implemented fine-grained software enforcement when Intel MBA was insufficiently precise.
Evaluation Infrastructure
Built contention experiments, collected performance data, and analyzed slowdown and overhead.
I designed and implemented the profiling, phase-analysis, policy, and bandwidth-enforcement pipeline. I built the experimental infrastructure, evaluated the system using real and synthetic workloads, and analyzed application behavior under cache and memory-bandwidth contention.
ProPer shows how low-overhead runtime profiling can turn changing application behavior into practical shared-resource policies.